Articles tagged with javascript tag
I’d like to introduce you to my little pet project, which might just as well be awarded the first pet project I’ve ever completed, called Outline Maps of the World.
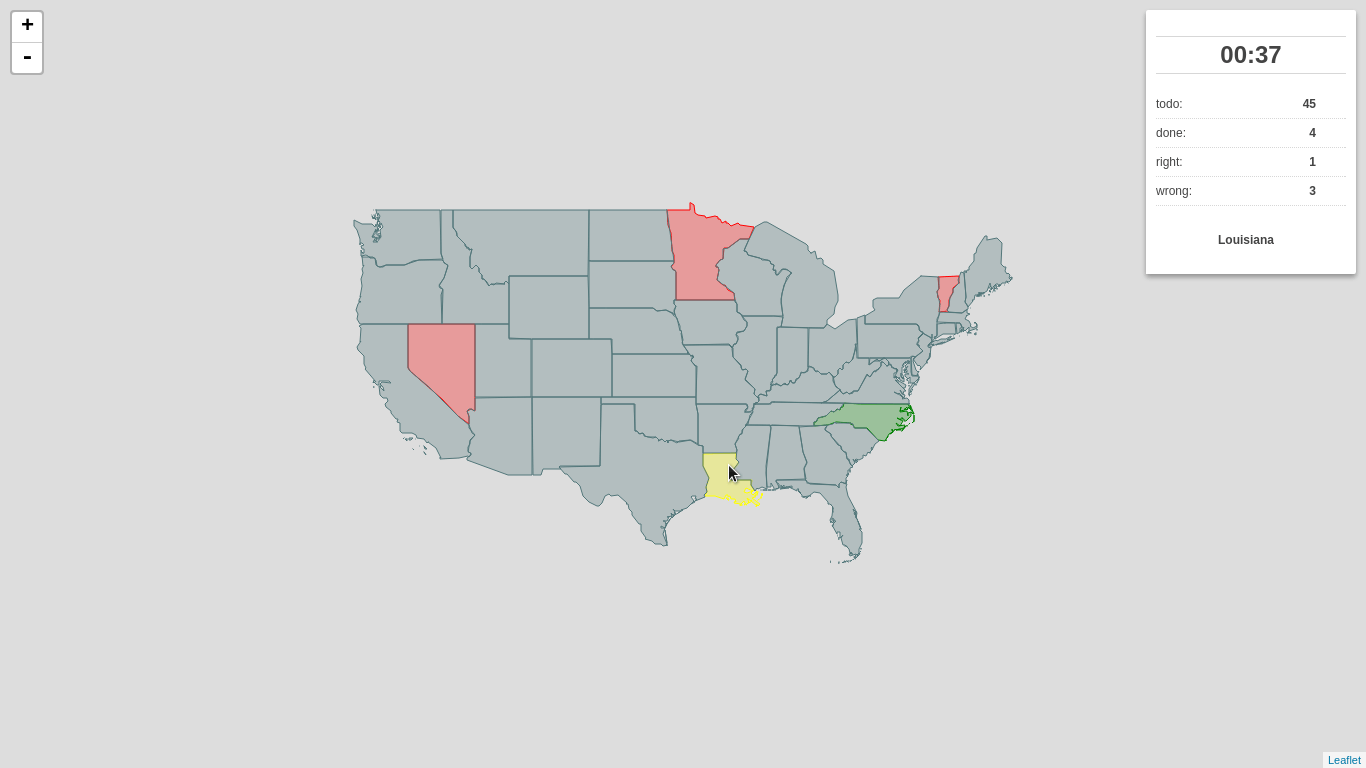
It’s a very simple, yet useful web application built on top of the great Leaflet library meant to help you get to know our world a bit better. As the name suggests, the app shows you, well… a blind map, and you try to fill as many features as you can.
The app is ready and can be used:
- online at Outline Maps of the World with the map of your choice (if available)
- offline, downloaded to your computer and filled with whatever data you want
What I find great about this project is the ease of adding new dataset. For starters, I filled it with data coming from Natural Earth:
- CONUS states
- European states
- World capitals
If you wish, feel free to send me a pull request with GeoJSON data, I’ll be happy to have more datasets available! The process is described at the project homepage.
As you notice at the project homepage, there are two versions of the game available:
- one lets you find map features by their names
- the other one lets you type name highlighted feature (much tougher)
Have fun!
Two years ago I was pretty happy with this little piece of code to transform degrees to the decimal value. Yesterday, I found a neater way to do the same:
let deg = [50, 30, 0];

function degToDec(prev, cur, curIndex) {
    return prev + cur / Math.pow(60, curIndex);
}

deg.reduce(degToDec);
Once you have an input array, that’s pretty much it. Love JavaScript.
Disclaimer: I’m an enthuastic developer, but I do not code for a living. I’m just the ordinary guy who keeps editing a wrong file wondering why the heck the changes are not being applied.
TL;DR: I do think npm might be the answer.
Wonderful world of JavaScript DevOps
When I first started using JavaScript on the server side with node.js, I felt overwhelmed by numerous options to automate tasks. There was npm taking care of backend dependencies. Then I would build a frontend and found out about bower for handling frontend dependencies. Then it would be great to have some kind of minification/obfuscation/uglification/you-name-it task. And the build task. And the build:prod task. And how about eslint task? And then I would end up spending hours doing nothing, just reading blogs about the tools being used by others who do code for a living.
Intermezzo: I think my coding is slow. Definitely slower than yours. I’m getting better though.
Using the force
Looking back I find it a bit stressful - how the heck do I choose the right tools? Where’s Yoda to help me out? Anyway, next to adopt after npm was bower. And I liked it, even though some packages were missing - but who cares as long as there is no better way, right? Except there is… I guess.
Automation was next in the line to tackle. So I chose gulp without a bit of hesitation. It was a hype, a bigger than grunt back then. I even heard of yeoman, but until now I still don’t know what it actually does. And I’m happy with that.
A short summary so far:
npm for backend dependenciesbower for frontend dependenciesgulp for running tasks
So far, so good.
Is Bower going to die?
Then I stumbled upon this tweet and started panicking. Or rather started to feel cheated. It took me time to set all this up and now it’s useless? Or what?
Seeing it now, I’m glad I read this. And I really don’t know what happened to Bower, if anything at all.
Keeping it simple
So Bower’s dying, what are you going to do about that? You’ll use npm instead! And you’ll have a single source of truth called package.json. You’l resolve all the dependencies with a single npm install command and feel like a king. We’re down to two now - npm and gulp.
Gulp, Gulp everywhere!
When you get rid of Bower, next feeling you have is your gulpfile.js just got off the leash. It got really big and grew to ~160 lines of code and became a nightmare to manage.
So you split it into task files and a config file. What a relief. But you still realize a half of your package.json dependencies starts with gulp-. And you hate it.
Webpack for the win
For me, a non-developer, setting the webpack wasn’t easy. I didn’t find docs very helpful either. Reading the website for the first time, I didn’t even understand what it should be used for. I got it working eventually. And I got rid of gulp, gulp-connect, gulp-less, gulp-nodemon, gulp-rename, gulp-replace, gulp-task-listing and gutil. And the whole gulpfile.js. That was a big win for me.
But how do you run tasks?
Well…
npm run start-dev # which in turn calls the code below
npm run start-webpack & NODE_ENV=development nodemon server.js # where start-webpack does the following
node_modules/webpack-dev-server/bin/webpack-dev-server.js --quiet --inline --hot --watch
That’s it. If I need to build code, I run npm run build, which calls some other tasks from scripts section in the package.json.
That’s pretty much it. I don’t think it’s a silver bullet, but I feel like I finally found peace of mind for my future JavaScript development. At least for a month or so before some other guy comes to town.
Last time I described the setup of my OpenShift Twitter crawler and let it running and downloading data. It’s been more than two months since I started and I got interesting amount of data. I also made a simple ETL process to load it into my local PostGIS database, which I’d like to cover in this post.
Extract data
Each day is written to the separate sqlite file with a name like tw_day_D_M_YYYY. Bash is used to gzip all the files before downloading them from OpenShift.
#!/bin/bash

ssh openshift << EOF
    cd app-root/data
    tar czf twitter.tar.gz *.db
EOF

scp openshift:/var/lib/openshift/55e487587628e1280b0000a9/app-root/data/twitter.tar.gz ./data
cd data &&
tar -xzf twitter.tar.gz &&
cd -

echo "Extract done"
Transform data
The transformation part operates on downloaded files and merges them into one big CSV file. That’s pretty straightforward. Note that’s quite simple with sqlite flags, some sed and tail commands.
#!/bin/bash

rm -rf ./data/csv
mkdir ./data/csv

for db in ./data/*.db; do
    FILENAME=$(basename $db)
    DBNAME=${FILENAME%%.db}
    CSVNAME=$DBNAME.csv
    echo "$DBNAME to csv..."
    sqlite3 -header -csv $db "select * from $DBNAME;" > ./data/csv/$CSVNAME
done

cd ./data/csv
touch tweets.csv
echo $(sed -n 1p $(ls -d -1 *.csv | head -n 1)) > tweets.csv # get column names

for csv in tw_*.csv; do
    echo $csv
    tail -n +2 $csv >> tweets.csv # get all lines without the first one
done
Load data
In the last step, the data is loaded with SQL \copy command.
#!/bin/bash

export PG_USE_COPY=YES

DATABASE=mzi_dizertace
SCHEMA=dizertace
TABLE=tweets

psql $DATABASE << EOF
    DROP TABLE IF EXISTS $SCHEMA.$TABLE;
    CREATE UNLOGGED TABLE $SCHEMA.$TABLE (id text, author text, author_id text, tweet text, created_at text, lon float, lat float, lang text);
    \copy $SCHEMA.$TABLE FROM 'data/csv/tweets.csv' CSV HEADER DELIMITER ','
    ALTER TABLE $SCHEMA.$TABLE ADD COLUMN wkb_geometry geometry(POINT, 4326);
    UPDATE $SCHEMA.$TABLE SET wkb_geometry = ST_SetSRID(ST_MakePoint(lon, lat), 4326);
    CREATE INDEX ${TABLE}_geom_idx ON $SCHEMA.$TABLE USING gist(wkb_geometry);
    COMMIT;
EOF
First statistics
Some interesting charts and numbers follow.


After a while I got back to my PostGIS open data case study. Last time I left it with clustering implemented, looking forward to incorporate Turf.js in the future. And the future is now. The code is still available on GitHub.
Subgroup clustering
Vozejkmap data is categorized based on the place type (banks, parking lots, pubs, …). One of the core features of map showing such data should be the easy way to turn these categories on and off.
As far as I know, it’s not trivial to do this with the standard Leaflet library. Extending L.control.layers and implement its addOverlay, removeOverlay methods on your own might be the way to add needed behavior. Fortunately, there’s an easier option thanks to Leaflet.FeatureGroup.SubGroup that can handle such use case and is really straightforward. See the code below.
cluster = L.markerClusterGroup({
    chunkedLoading: true,
    chunkInterval: 500
});

cluster.addTo(map);

...

for (var category in categories) {
    // just use L.featureGroup.subGroup instead of L.layerGroup or L.featureGroup
    overlays[my.Style.set(category).type] = L.featureGroup.subGroup(cluster, categories[category]);
}

mapkey = L.control.layers(null, overlays).addTo(map);
With this piece of code you get a map key with checkboxes for all the categories, yet they’re still kept in the single cluster on the map. Brilliant!

Using Turf.js for analysis
Turf is one of those libraries I get amazed easily with, spending a week trying to find a use case, finally putting it aside with “I’ll get back to it later”. I usually don’t. This time it’s different.
I use Turf to get the nearest neighbor for any marker on click. My first try ended up with the same marker being the result as it was a member of a feature collection passed to turf.nearest() method. After snooping around the docs I found turf.remove() method that can filter GeoJSON based on key-value pair.
Another handy function is turf.distance() that gives you distance between two points. The code below adds an information about the nearest point and its distance into the popup.
// data is a geojson feature collection
json = L.geoJson(data, {
    onEachFeature: function(feature, layer) {
        layer.on("click", function(e) {
            var nearest = turf.nearest(layer.toGeoJSON(), turf.remove(data, "title", feature.properties.title)),
                distance = turf.distance(layer.toGeoJSON(), nearest, "kilometers").toPrecision(2),
                popup = L.popup({offset: [0, -35]}).setLatLng(e.latlng),
                content = L.Util.template(
                    "<h1>{title}</h1><p>{description}</p> \
                    <p>Nejbližší bod: {nearest} je {distance} km daleko.</p>", {
                    title: feature.properties.title,
                    description: feature.properties.description,
                    nearest: nearest.properties.title,
                    distance: distance
                });

            popup.setContent(content);
            popup.openOn(map);

            ...
From what I’ve tried so far, Turf seems to be incredibly fast and easy to use. I’ll try to find the nearest point for any of the categories, that could take Turf some time.
Update
Turf is blazing fast! I’ve implemented nearest point for each of the categories and it gets done in a blink of an eye. Some screenshots below. Geolocation implemented as well.
 You can locate the point easily.
 You can hide the infobox.
 You can jump to any of the nearest places.