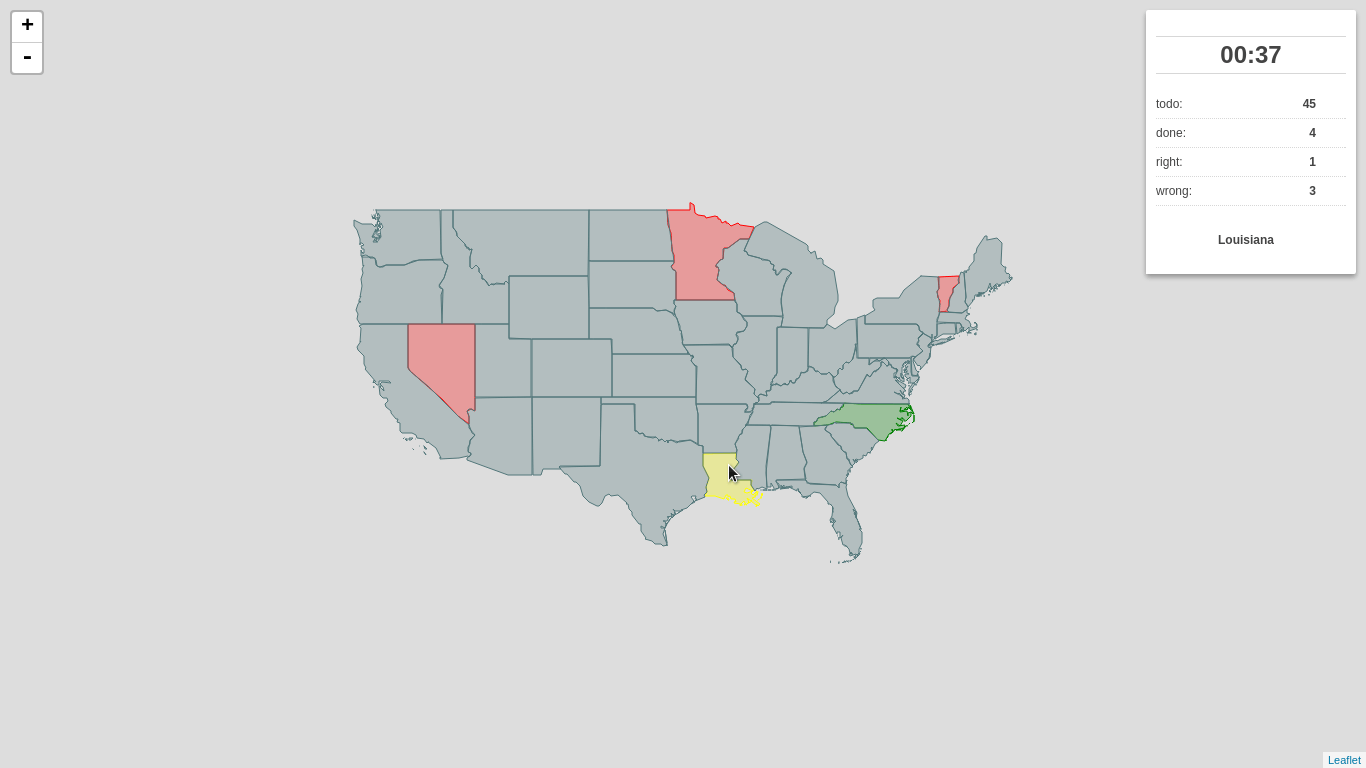
I’d like to introduce you to my little pet project, which might just as well be awarded the first pet project I’ve ever completed, called Outline Maps of the World.
It’s a very simple, yet useful web application built on top of the great Leaflet library meant to help you get to know our world a bit better. As the name suggests, the app shows you, well… a blind map, and you try to fill as many features as you can.
offline, downloaded to your computer and filled with whatever data you want
What I find great about this project is the ease of adding new dataset. For starters, I filled it with data coming from Natural Earth:
CONUS states
European states
World capitals
If you wish, feel free to send me a pull request with GeoJSON data, I’ll be happy to have more datasets available! The process is described at the project homepage.
As you notice at the project homepage, there are two versions of the game available:
one lets you find map features by their names
the other one lets you type name highlighted feature (much tougher)
Vozejkmap data is categorized based on the place type (banks, parking lots, pubs, …). One of the core features of map showing such data should be the easy way to turn these categories on and off.
As far as I know, it’s not trivial to do this with the standard Leaflet library. Extending L.control.layers and implement its addOverlay, removeOverlay methods on your own might be the way to add needed behavior. Fortunately, there’s an easier option thanks to Leaflet.FeatureGroup.SubGroup that can handle such use case and is really straightforward. See the code below.
cluster=L.markerClusterGroup({chunkedLoading:true,chunkInterval:500});cluster.addTo(map);...for(varcategoryincategories){// just use L.featureGroup.subGroup instead of L.layerGroup or L.featureGroupoverlays[my.Style.set(category).type]=L.featureGroup.subGroup(cluster,categories[category]);}mapkey=L.control.layers(null,overlays).addTo(map);
With this piece of code you get a map key with checkboxes for all the categories, yet they’re still kept in the single cluster on the map. Brilliant!
Using Turf.js for analysis
Turf is one of those libraries I get amazed easily with, spending a week trying to find a use case, finally putting it aside with “I’ll get back to it later”. I usually don’t. This time it’s different.
I use Turf to get the nearest neighbor for any marker on click. My first try ended up with the same marker being the result as it was a member of a feature collection passed to turf.nearest() method. After snooping around the docs I found turf.remove() method that can filter GeoJSON based on key-value pair.
Another handy function is turf.distance() that gives you distance between two points. The code below adds an information about the nearest point and its distance into the popup.
// data is a geojson feature collectionjson=L.geoJson(data,{onEachFeature:function(feature,layer){layer.on("click",function(e){varnearest=turf.nearest(layer.toGeoJSON(),turf.remove(data,"title",feature.properties.title)),distance=turf.distance(layer.toGeoJSON(),nearest,"kilometers").toPrecision(2),popup=L.popup({offset:[0,-35]}).setLatLng(e.latlng),content=L.Util.template("<h1>{title}</h1><p>{description}</p> \ <p>Nejbližší bod: {nearest} je {distance} km daleko.</p>",{title:feature.properties.title,description:feature.properties.description,nearest:nearest.properties.title,distance:distance});popup.setContent(content);popup.openOn(map);...
From what I’ve tried so far, Turf seems to be incredibly fast and easy to use. I’ll try to find the nearest point for any of the categories, that could take Turf some time.
Update
Turf is blazing fast! I’ve implemented nearest point for each of the categories and it gets done in a blink of an eye. Some screenshots below. Geolocation implemented as well.
Using SVG to build web maps have both pros and cons and to be honest I don’t know any serious map/GIS project built on top of SVG. However, as a part of my job at university, I was forced to use both SVG and SMIL to produce animated web map (see the small version below or the big one at GitHub) and I’d like to share my findings.
Animate destinations one by one. They are revealed in order of their distance from PRG.
Animate airways.
Once airways are animated, animate airplanes along their path from PRG to their destination in order of their time of departure.
Profit.
My goal was to create an animation of all departures from Vaclav Havel airport during one day. These data can be obtained at FlightStats, I didn’t find a way make this process automatic though. OpenFlights might be better source then.
SVG creation
Kartograph is a great tool both for SVG generation and scripting. What a pity it’s probably a dead project according to the last commit date. After installing Python part of library used to create SVG files out of vector geometries, it can be run with something like this:
It is possible to adjust map settings in many different ways. The most important/interesting:
Choose what attributes you want to have exported from source file with attributes key for every layer. They’ll be available as data- attribute of SVG elements.
It comes with Grid generation packed in! Really great. Sea generation works for some projections only.
Set the projections you want to use with additional settings.
bounds settings should - according to the docs - use layer extent as well, I couldn’t make it work though. Use [-180, -90, 180, 90] as a workaround to get the whole world. Don’t forget to set padding, so your map doesn’t get clipped on edges.
exporting coordinates rounded to one decimal place makes your SVG a lot smaller.
You can change SVG look with simple CSS, just be sure to use layer names as CSS ids:
SMIL is a XML based language for multimedia representation. It comes ready for timing, animation, visual transitions etc. I guess it might be considered easier to read for a web development beginner. Once you start using it, you immediately realize it suffers from the same disease like XML does: it is so wordy!
Let’s get back to my example. To animate airports one by one, let’s give them unique ids, so they look something like:
That’s something you do by hand as kartograph doesn’t give ids to SVG elements. Once you’re done with that, you can run SMIL animation. If you look closer at the final map, you’ll notice there are three properties animated for each airport: fill opacity, stroke opacity and radius. Each property needs to use separate SMIL<animate />, which might look like the one below:
I guess you get the idea how long this would take for more airports. Make sure to notice that SMIL can start animation based on another animation’s end (osr_ani.end) - that’s pretty neat.
Airways animation works almost the same. First, add unique id to each airway:
Once airways animation has finished, let airplanes fly around the globe with a simple JavaScript function:
/** * @param number coef scale radius by number of flights to the given destination * @param string flight_id */varcircle=function(coef,flight_id,timeshift){varsvgns="http://www.w3.org/2000/svg"; var svgDocument =document; var motion = svgDocument.createElementNS(svgns,"animateMotion"); var animation = svgDocument.createElementNS(svgns,"animate"); var shape = svgDocument.createElementNS(svgns, "circle"); var time = 15 + timeshift; var dur = document.getElementById(flight_id).getAttributeNS(null, "data-dist")/100; motion.setAttribute("begin", time + "s"); motion.setAttribute("dur", dur + "s"); motion.setAttribute("path", document.getElementById(flight_id).getAttributeNS(null, "d")); motion.setAttribute("xlink:href", "#" + flight_id); motion.setAttribute("id", flight_id + "_motion"); animation.setAttribute("attributeName", "opacity"); animation.setAttribute("from", "1"); animation.setAttribute("to", "0"); animation.setAttribute("begin", time + dur + "s"); animation.setAttribute("dur", "0.1s"); animation.setAttribute("fill", "freeze"); shape.setAttributeNS(null, "r", 1*coef); shape.setAttributeNS(null, "fill", "1f78b4"); shape.setAttributeNS(null, "stroke", "1f78b4"); shape.setAttribute("id", "airplane-" + flight_id); shape.appendChild(motion); shape.appendChild(animation); document.getElementById("airplanes").appendChild(shape);}
SMIL with SVG seems to be interesting option for web map animation, a bit lengthy though. Syncing animations can easily become pain in the ass (see StackOverflow thread). Never call your function animate - there is namesake function defined in Web Animations API that makes animation crash in Chrome. <animateMotion /> is a great tool to animate elements along path.
I was made to use ArcGIS Server with Openlayers 3 just recently as one of the projects I’ve been working on demands such different tools to work together.
tl;dr: I hate Esri.
I found myself in need to access secured layers published via WMS on ArcGIS Server using username and password I was given, so here’s a little how-to for anyone who would have to do the same.
Let’s start with a simple ol.layer.Image and pretend this is the secured layer we’re looking for:
var layer = new ol.layer.Image({
    extent: extent,
    source: new ol.source.ImageWMS(/** @type {olx.source.ImageWMSOptions} */ ({
        url: url,
        params: {
            'LAYERS': 'layer',
            'CRS': 'EPSG:3857',
        }
    }))
});
We need to retrieve the token, so we define a function:
functionretrieveToken(callback){varreq=newXMLHttpRequest;req.onload=function(){if(req.status=="200"){varresponse=JSON.parse(req.responseText);if(response.contents){callback(response.contents);// response contents is where the token is stored}};req.open("get","http://server.address/arcgis/tokens/?request=getToken&username=username&password=password&expiration=60",true);req.send()}
I pass a parameter called callback - that’s a very important step, otherwise you would not be able to retrieve the token when you actually need it (AJAX stands for asynchronous). Now you just pass the token to the layer params like this:
When you open Firebug and inspect Network tab, you should find tokenURL parameter passed along with WMSGetMap request.
Few sidenotes:
Although you might be logged in ArcGIS Server via web interface, you might need to pass the tokenURL param when trying to access Capabilities document. Don’t know why though.
You should probably take care of calling the retrieveToken() in shorter interval than the token expiration is set to. Otherwise you might end up with invalid token.
You need to hide the username and password from anonymous users (I guess that’s only possible with server side implementation of selective JavaScript loading).

 You can locate the point easily.
 You can hide the infobox.
 You can jump to any of the nearest places.