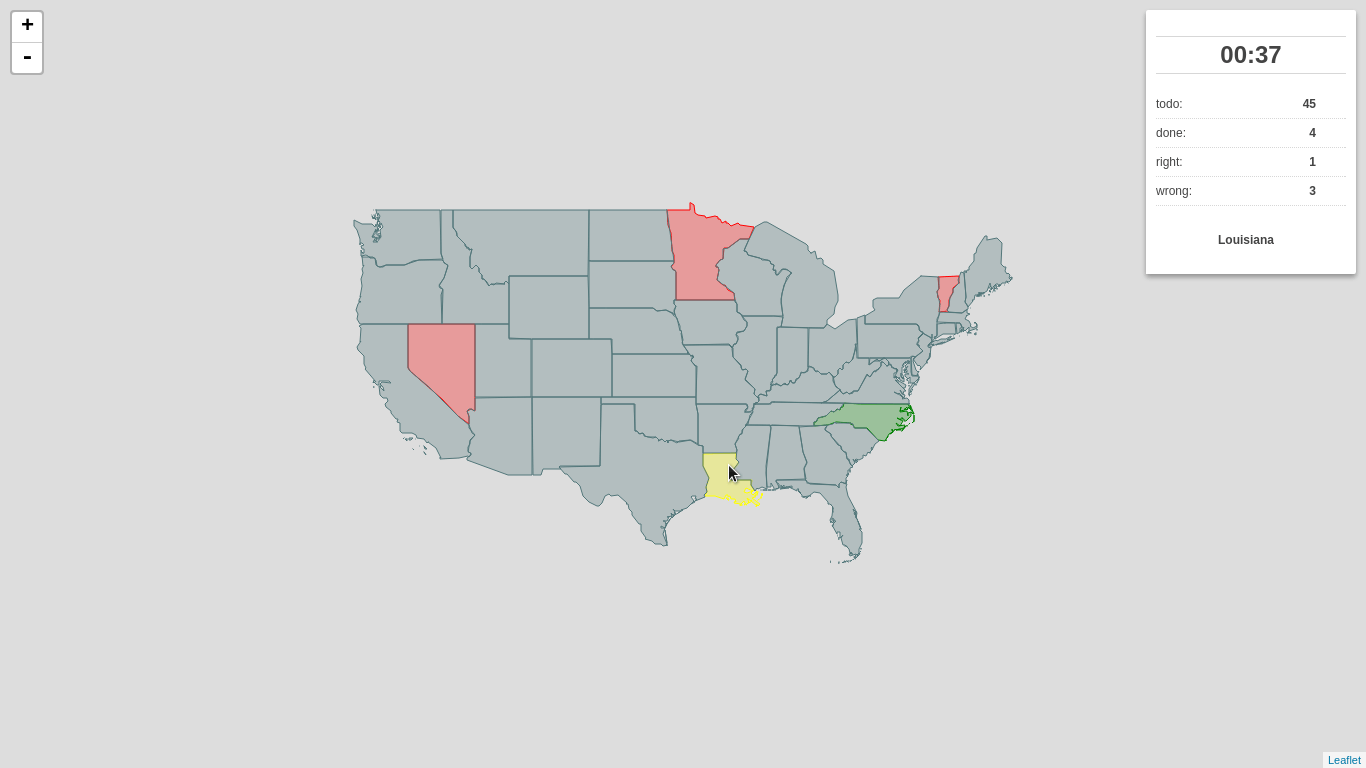
I’d like to introduce you to my little pet project, which might just as well be awarded the first pet project I’ve ever completed, called Outline Maps of the World.
It’s a very simple, yet useful web application built on top of the great Leaflet library meant to help you get to know our world a bit better. As the name suggests, the app shows you, well… a blind map, and you try to fill as many features as you can.
The app is ready and can be used:
- online at Outline Maps of the World with the map of your choice (if available)
- offline, downloaded to your computer and filled with whatever data you want
What I find great about this project is the ease of adding new dataset. For starters, I filled it with data coming from Natural Earth:
- CONUS states
- European states
- World capitals
If you wish, feel free to send me a pull request with GeoJSON data, I’ll be happy to have more datasets available! The process is described at the project homepage.
As you notice at the project homepage, there are two versions of the game available:
- one lets you find map features by their names
- the other one lets you type name highlighted feature (much tougher)
Have fun!
After a while I got back to my PostGIS open data case study. Last time I left it with clustering implemented, looking forward to incorporate Turf.js in the future. And the future is now. The code is still available on GitHub.
Subgroup clustering
Vozejkmap data is categorized based on the place type (banks, parking lots, pubs, …). One of the core features of map showing such data should be the easy way to turn these categories on and off.
As far as I know, it’s not trivial to do this with the standard Leaflet library. Extending L.control.layers and implement its addOverlay, removeOverlay methods on your own might be the way to add needed behavior. Fortunately, there’s an easier option thanks to Leaflet.FeatureGroup.SubGroup that can handle such use case and is really straightforward. See the code below.
cluster = L.markerClusterGroup({
    chunkedLoading: true,
    chunkInterval: 500
});

cluster.addTo(map);

...

for (var category in categories) {
    // just use L.featureGroup.subGroup instead of L.layerGroup or L.featureGroup
    overlays[my.Style.set(category).type] = L.featureGroup.subGroup(cluster, categories[category]);
}

mapkey = L.control.layers(null, overlays).addTo(map);
With this piece of code you get a map key with checkboxes for all the categories, yet they’re still kept in the single cluster on the map. Brilliant!

Using Turf.js for analysis
Turf is one of those libraries I get amazed easily with, spending a week trying to find a use case, finally putting it aside with “I’ll get back to it later”. I usually don’t. This time it’s different.
I use Turf to get the nearest neighbor for any marker on click. My first try ended up with the same marker being the result as it was a member of a feature collection passed to turf.nearest() method. After snooping around the docs I found turf.remove() method that can filter GeoJSON based on key-value pair.
Another handy function is turf.distance() that gives you distance between two points. The code below adds an information about the nearest point and its distance into the popup.
// data is a geojson feature collection
json = L.geoJson(data, {
    onEachFeature: function(feature, layer) {
        layer.on("click", function(e) {
            var nearest = turf.nearest(layer.toGeoJSON(), turf.remove(data, "title", feature.properties.title)),
                distance = turf.distance(layer.toGeoJSON(), nearest, "kilometers").toPrecision(2),
                popup = L.popup({offset: [0, -35]}).setLatLng(e.latlng),
                content = L.Util.template(
                    "<h1>{title}</h1><p>{description}</p> \
                    <p>Nejbližší bod: {nearest} je {distance} km daleko.</p>", {
                    title: feature.properties.title,
                    description: feature.properties.description,
                    nearest: nearest.properties.title,
                    distance: distance
                });

            popup.setContent(content);
            popup.openOn(map);

            ...
From what I’ve tried so far, Turf seems to be incredibly fast and easy to use. I’ll try to find the nearest point for any of the categories, that could take Turf some time.
Update
Turf is blazing fast! I’ve implemented nearest point for each of the categories and it gets done in a blink of an eye. Some screenshots below. Geolocation implemented as well.
 You can locate the point easily.
 You can hide the infobox.
 You can jump to any of the nearest places.
I am writing a diploma thesis focused on extracting spatial data from social networks. I have been working mainly with Twitter API and results I have got so far look really promising. This post was written as a reaction to many retweets I got when I shared one of my visualizations. It aims to make it clear how to connect to Twitter Streaming API using node.js, Leaflet and SQLite and retrieve tweets to analyze them later.
If you have any further questions after reading this paper, feel free to contact me via Twitter or e-mail. I must say right here that the code will be shared as well as the map, but there are still some bugs/features I would like to remove/add.
On a side note: I have been studying cartography and GIS for the last five years at Masaryk University in Brno, Czech Republic. I am mostly interested in ways computers can make data handling easier. I like to code in Python.
Using Twitter Streaming API
As you probably know, Twitter offers three different APIs:
- REST API which is obviously RESTful. You can access almost every piece of information on Twitter with this one: tweets, users, places, retweets, followers…
- Search API used for getting search results. You can customize these by sending parameters with your requests.
- Streaming API which I am going to tell you about. It is really different, as (again, obviously) it keeps streaming tweets from the time you connect to the server. This means, once the connection is made, it has to stay open as long as you want tweets coming to you. The important thing here is that you get real time tweets delivered to you via this stream, which implies you cannot use this API to get tweets already tweeted.
To sum it up: You get a small sample of tweets in a real time as long as the connection to the server stays open.
What you need
To use any of the Twitter APIs, you need to authenticate you (or your app) against Twitter via OAuth protocol. To be able to do so, you need a Twitter account, because only then you can create apps, obtain access tokens and get authenticated for API use.
And then, obviously, you need something to connect to server with. I chose node.js because it seemed as a good tool to keep connection alive. I have also been interested in this technology for the couple of months but never really had a task to use it for.
The good thing about node.js is that it comes with lots of handy libraries. You get socket.io for streaming, ntwitter for using Twitter API and sqlite3 for working with SQLite databases.
You need something to store the data in also. As mentioned, I picked SQLite for this task. It is lightweight, does not need server nor configuration to run, just what I was looking for. Seems we are set to go, right?
Filtering the data
I guess none of you is interested in obtaining random tweets from around the world, neither was I. I live in the Czech republic and that is the area I want to get tweets from. How?
It is fairly simple, you tell Twitter with the locations parameter of statuses/filter resource. This parameter specifies a set of bounding boxes to track.
To sum it up: you connect to the server and tell it you just want to get tweets from the area you specified with the locations parameter. The server understands and keeps you posted.
Is it that simple?
No. Twitter decides whether to post you the tweet or not according to what the value of coordinates field is. It goes like this:
- If the
coordinates field is not empty, it gets tested against the bounding box. If it matches, it is sent to the stream.
- If the
coordinates field is empty, but the place field is not, it is the place field that gets checked. If if it by any extent intersects the bounding box, it is sent to the stream.
- If both of the fields are empty, nothing is sent.
I decided to throw away the tweets with the empty coordinates field, because the accuracy of the value specified in the place field can be generally considered very low and insufficient for my purposes. You still need to account for position inaccuracies of users’ devices though, however that is not something that we can deal with. Let us just assume that geotagged tweets are accurate.

Figure: Twitter seems not to be very accurate when matching tweets against bounding box.
Although, as you can see in the picture, they are not. Or they are, but Twitter is not good at telling so. Besides that, none of the countries in the world is shaped like a rectangle and we would need to clip the data anyway. That is where SQLite comes in, because I have been saving incoming tweets right into the database.
If you use any GUI manager (sqlitebrowser for Linux is just fine), you can easily export your data to the CSV file, load it into QGIS, clip it with Natural Earth countries shapefile and save them to the GeoJSON file. It is just a matter of few JavaScript lines of code to put GeoJSON on a Leaflet map.
Displaying the data
Once a GeoJSON file is ready, it can be used for making an appealing viz to get a sense of what may be called “nationalities spatial patterns”. The lang field (stored in the database, remember?) of every tweet is used to colour the marker accordingly. Its value represents a two-letter language code as specified in ISO 639-1 document.
However, as those codes are guessed by Twitter’s language algorithms, they are prone to error. There are actually three scenarios we might be facing:
- User tweets in the same language as used in the Twitter account.
- User tweets in his/her mother language, but has set different Twitter account language.
- User does not tweet in his/her mother language, but has it set as a Twitter account language.
We basically have to deal with 2) and 3), because 1) means we can be pretty sure what nationality the user is. Sadly though, I have not found an easy way to tell which one of these two we came across, thus which language settings should be prioritized. I made an arbitrary decision to prioritize the language the tweet was written in, based on assumption that the most of the users tweet in their mother language. No matter what you do, the data is still going to be biased by automatically generated tweets, especially ones sent by Foursquare saying “I’m at @WhateverBarItIs (http://someurl.co)”. It works fine for the strange languages like Russian and Arabic though.
From Jan 2 to Jan 4 this year 5,090 tweets were collected. Leaflet is becoming a little sluggish without clustering turned on displaying all of them. Plans are to let the collection run until Jan 7 and then put all the tweets on the map. I guess that might be around 10,000 geotagged tweets by that time.
I am definitely willing to share the code and the final viz. Meanwhile, you can have a look at the screenshot on picture [*]. I have already implemented nationality switch (legend items are clickable) and I would like to add a day/night switch to see whether there are any differences between the peoples’ behaviour.

Figure: Final map screenshot. A legend is used to turn nationalities on and off. You are looking at Prague by the way.
Obviously the most tweets were sent from the most populated places, e.g. Prague, Brno, Ostrava.